- 1.Overview of RHPCG
- 2.Introduction of interfaces
- 3.Search Menu
- 3.1 Search by Genes
- 3.1.1 Search Result--Infomation Box
- 3.1.2 Search Result--Hippo Gene Infomation
- 3.1.3 Search Result--Motif Presentation
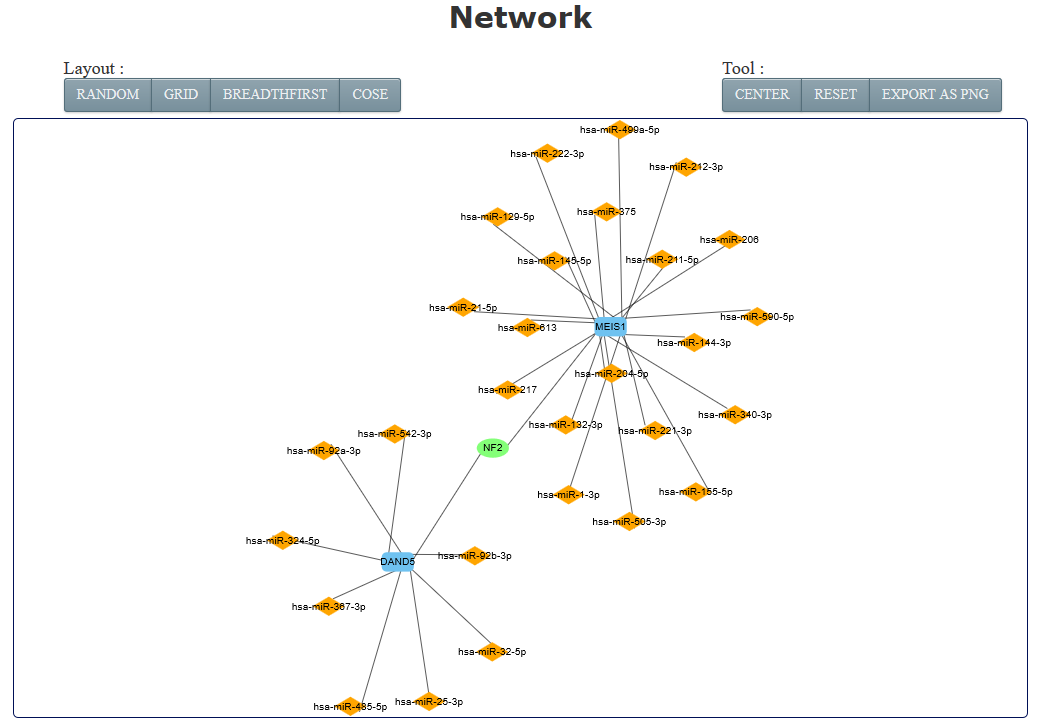
- 3.1.4 Search Result--Network Visualization
- 3.1.5 Search Result--Direct Target
- 3.2 Search by Cancer
- 4.Statistic Menu
- 4.1 View the Data of RHPCG
- 5.Download Menu
- 5.1 Download Motif Data
Hippo signaling pathway is a highly conserved pathway, which is consisted of a group of kinases, such as STE20-like protein kinases (STK3, also known as MST2, and STK4, also known as MST1), the large tumor suppressors (LATS1 and LATS2) and so on (A). As we known, hippo signaling pathway controls tissue development and organ size. Recently, many studies discovered that Hippo signaling pathway also play key roles in cancer initiation and progression. Dysregulation of Hippo signaling pathway may lead to cancer, such as breast cancer, lung cancer and so on. Hippo signaling can regulate other pathway switch, which is mediated by regulatory factors, such as transcription factor (TF), microRNA (miRNA), long non-coding RNA (lncRNA) and circular RNA (circRNA) at the transcriptional or post-transcriptional levels. The regulators interact with the Hippo genes in kinds of motifs, which are the basic patterns in the regulatory network. However, a database with a multi-omics analysis and visualization of Hippo genes in cancer and comprehensive Hippo regulatory relationships is still lacking. Hence, we developed this database named RHPCG (Regulation of the Hippo Panthway in Cancer Genome) (available at http://www.medsysbio.org/RHPCG), which can be conducive to the exploration of the mechanism of Hippo signaling pathway in carcinogenesis.
The RHPCG database provides a user-friendly web interface that allows user to browse, search, and download alterations of Hippo signaling pathway genes in pan-cancer at multiple levels of omics, as well as the regulatory motifs associated with the Hippo signaling pathway. The RHPCG interface has 2 distinct searching sections, either searching by genes or by cancer type. On the top of the "searching by gene" page, the multi-omics overview section provides an overview of the alterations of Hippo core genes across 33 cancer types at different levels of omics (A). At the bottom of the search page, RHPCG provides a search section (B). Users can select a gene from the list of the Hippo pathway core genes. The Ensembl ID or symbol of lncRNAs are also acceptable. Regarding miRNAs the search condition only supports search by miRNA name, whereas for circRNAs it only supports search by circRNA ID (B). In addition, all 11 types of motif are listed on the right (B). Users can choose one or more specific motif types for a more precise result. Additionally, we built a section in the database to enable users to search by cancer types (C). In this section, users can select a specific cancer (C) and view the mRNA expression, protein expression and DNA methylation of all Hippo core genes (C). In a similar manner, search results were divided into 3 main parts: The first part is the information box. The box contains the gene symbol, Entrez ID with link to source website, the location in the chromosome and a brief description of the function of the gene (Figure 3D). In the case of a lncRNA, the box shows the Ensembl ID, symbol and type (lincRNA, antisense, sense intronic, etc.) of the lncRNA (D). For a miRNA, the box contains the accession number and mature sequence obtained from miRBase (D). Regarding a circRNA, the box contains the best transcript, annotation and sequence from circBase (D). The information box also contains external links to NCBI, miRbase, Ensemble or circBase for more details (D). The second part is the visualization of the mutation frequency, copy number alteration, mRNA expression, protein expression and methylation level in 33 cancer types (E). In the third part, all the motifs containing at least one of the gene/miRNA/lncRNA/circRNA for which the users inquired are listed in the table of motifs (F). Accordingly, the results of each motif type could be visualized as a network. The network presentation at the bottom of the search result page can be adjusted by the legends on top of the display board. Users can also restructure the presentation themselves. The roller controls the size of the picture, and the node can be towed to the site the user desires. The RHPCG database allows users to download the search results as either a list of motifs or a network graph (G). Concomitantly, RHPCG enables users to view the potential targets of Hippo signaling pathway genes (Figure 3H). These interaction genes, which could constitute potential targets of the Hippo signaling pathway, were collected from the Pathway Commons database (http://www.pathwaycommons.org) (H). We used the t-test to examine whether these potential target genes were differentially expressed between cancer samples with high and low expression of Hippo pathway genes. Consecutively, cancer samples were grouped according to the mid-value of the mRNA expression of Hippo pathway core genes (H). Obtained P values represented statistical significance (H). In the "Download" page, users can download multi-omics datasets of Hippo signaling pathway genes, direct target interactions and all information on the 11 motif types. Users can conveniently access the link by clicking on the navigation panel on the right (I).
On the top of the “Search by Genes” page, the multi-omics overview section, users can have an overview of the Hippo core genes alterations across 33 cancer types at different omics level. When users click the thumbnail, the landscape of the corresponding omics will be spread (1).
In particular, users can move the cursor on each small block to get the detailed Hippo gene information (1-2).
The gene with plotting is highlighted by dotted red line (1). Y axis means the distribution of mRNA expression, beta-value of methylation and expression of protein in all cancer types (2). And x axis means the all cancer types which we get from TCGA (3).
On the bottom of “Search” page, RHPCG provide a search section (1-4). Users can select gene from the Hippo pathway core genes list. The Ensembl ID or Symbol of lncRNAs are acceptable. The search condition of miRNAs only supports by miRNA name, and circRNA only supports by circRNA ID (1).
In addition, all the 11 types of motif are listed on the right (2). users can choose one or more specific motif type for a more precise result (3).
The information of the coding gene, miRNA, lncRNA or circRNA will be listed in boxes on the top left corner of search result page (1-4). The box contains the gene symbol, Entrez ID with link to source website, the location in the chromosome and the brief description of the gene function (1). For a lncRNA, the box shows the Ensembl ID, symbol and type (lincRNA, antisense, sense intronic and so on) of lncRNA (2). For a miRNA, the box contains the accession number and mature sequence from miRBase (3). For a circRNA, the box contains the best transcript, annoation and sequence from circBase (4).
The gene version interface presents the visualization of the mutation frequency, copy number alteration, mRNA expression, protein expression and the level of methylation;(1-2)
All the motifs containing at least one gene/miRNA/lncRNA/circRNA that the users’ input are listed in the motifs table (1-2). And, the regulations of each motif type could be visualized as network with different layouts and can be exported in PNG format. Network consisting of more than 500 motifs is time-consuming and induces the crash of web browser. Thus, RHPCG only displays networks with motifs less than 500. However, all the results could be downloaded as xls.
The network presentation at the bottom of the search result page can be adjusted by the legends on top of the display board. Users can also restructure the presentation by yourself. The roller controls the size of picture, and the node can be towed to the site where the users want.
RHPCG enable users to view the potential direct target genes of Hippo signaling pathway genes (1). The interacted genes, which could be the potential targets of the Hippo signaling pathway, were collected from Pathway Commons database (http://www.pathwaycommons.org) (2). We used the T test to test whether the potential targets were differentially expressed between the cancer samples with high-expression and low-expression of Hippo pathway genes. The cancer samples were grouped by mid-value of Hippo pathway core genes’ mRNA expression (3). The P values were shown to represent the statistical significance (4).
We added a new section to the database to enable users to search by cancer types (1). In this section, user can select specific cancer (2) and view mRNA expression, protein expression and DNA methylation of all Hippo core genes (3). The details of this new functional section are shown in the following screenshot.
The “Statistic Menu” page shows an overview of RHPCG database. On this page, users can browse all the data sources and data size of this database.
Hippo-related multi-omics data sets and all types of motifs in the RHPCG are provided with download links on "Download" page. Users can conveniently access the link by clicking the navigation on the right.